

Description
Write a Python program (use Python 3) to find the top ten words in an input stream by number of occurrences and to make a bar-chart plot of them.
Your program will consist of the following three steps.
Tokenize
You can use the two, small programs in the class examples — wordTokenizer.py and wordAggregator.py — to get started. However, do not actually process things in that way! That would be quite inefficient. (For our purposes later, and quite soon, the modular approach of wordTokenizer.py and wordAggregator.py will be quite useful.)
Instead, read from standard input (STDIN), tokenize for words, and store them in a Python dictionary (which is akin to a map in Java). Use each dictionary entry’s value as a counter to count instances of that word (the entry’s key).
Eliminate stopwords — the very common words in English — and words just one character long as not being interesting. When tokenizing, split with “[\W+_]”, instead of with “\W+” as we did in wordTokenizer.py. (This also splits on “_”.) We won’t worry about preserving words with apostrophes for now (e.g., “won’t”). If we were to extend our program to be more robust and useful later, we surely would improve on our tokenizer, or find a good library for it.
Use the file stopwords-MySQL.txt for your stopwords. Your program can read in the file and make a stopword dictionary to use to check against to eliminate the stopwords as you are parsing the input stream.
Sort
The dictionary then needs to be sorted by its values (the word counts) descending, to be able to find the top ten words. Actually, sort by value descending, key ascending, in case any words tie on count.
Yes, one could be more efficient for this. For instance, one could use partial heap-sort to extract the top ten instead of sorting the entire dictionary. We would do that when we extended our program to a more robust version. But do not worry with this optimization for the assignment, unless you just want to.
Plot
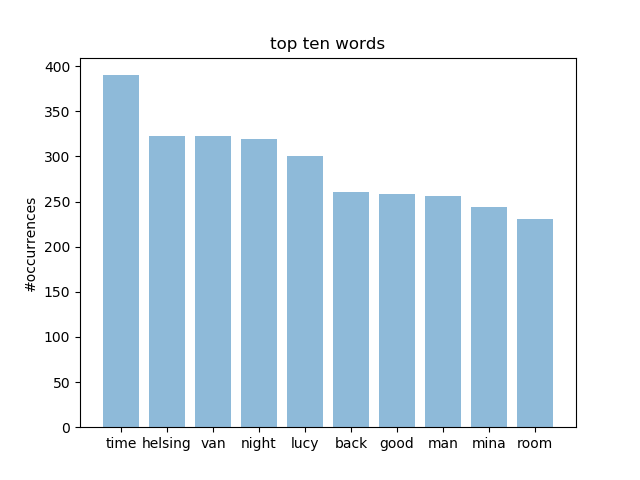
In the last step, your program should generate and launch a bar-chart plot of the top-ten words (with count – #occurrences – as the y-axis for the bars.
For example, my program topten.py run on the redirected input from file dracula-1879-TPG.txt produces the following plot.
Use packages (“libraries”)
import numpy as np
import matplotlib.pyplot as plot
to do the plot. (Of course, name your aliases (“np” and “plot”, above) as you want.) Follow the example at pythonspot: “matplotlib for bar-chart”.
We will be using Python 3 (Python, version 3) in this class. There are a few distinct differences between Python 2 and Python 3, and 3 did not preserve backward compatibility with 2! Python 3 is the new standard. In many environments (such as on the PRISM machines), however, python is still “2”.
To check, type in shell
% python -V
to see the version of your default python installation.
Python 3 on the PRISM machines
There is an installation on the PRISM machines (e.g., red.eecs.yorku.ca, etc.) that can be invoked by
% python3
under the standard enviroment. (It is at “/cs/local/bin/python3”.) And this is fine for most things.
However, this Python 3 does not have the packages we need. We can use another Python 3 installation, the Anaconda python distribution, which is installed in the PRISM environment too. This will suit our needs.
On PRISM, the path to Anaconda’s python3 is
/eecs/local/pkg/anaconda3/bin
Add to your PATH (shell variable) for each shell you start up. E.g., for csh or variants,
% setenv PATH /eecs/local/pkg/anaconda3/bin:${PATH}
Or, of course, put this in your “~/.cshrc”, “~/.tcshrc” — or other appropriate “.*rc” file, appropriate for whichever shell you use — so you get Anaconda‘s python3 invoked always with
% python3 …
For bash (or the like) shell users,
% export PATH=/eecs/local/pkg/anaconda3/bin:${PATH}:$PATH
Or edit your “~/.bashrc”.
Python 3 on your machine
Python is quite easy to install. And you likely have (several) versions on Python already on your own machine that comes bundled with the OS. But the one immediately available to you at command line on your machine is likely Python 2. (The bundled Python on Mac OS X is still 2.)
Anaconda‘s distribution comes highly recommended, and quite easy to install on pretty much anything. (I personally do not like Anaconda just because it not fully open sourced. It is a corporate venture. I installed Python 3 on my Mac via macports.)
Name your program “topten.py”. It should work as
% python3 topten.py < input_file.txt
or
% cat input_file.txt | python3 topten.py
where “input_file.txt” is the name of some input text file, such as dracula-1879-TPG.txt. (On your machine, Python 3 might be invoked via the command “python”, depending on the installation.) This should pop up a window with the bar chart.
Note if you are logged into a PRISM machine remotely and do not have your machine configured to launch remote windows, this would fail. If this is your working environment, call, e.g.,
plot.savefig('TopTen.png')
at the end of your program instead of
plot.show()
This will make a PNG image file named “TopTen.png” with the bar chart instead of popping up a window.
Have the file stopwords-MySQL.txt in the same directory as your program “topten.py”, and write the program with that assumption.
Pull a few book files (“Plain Text UTF-8”) from The Project Gutenberg to test your code. That is how I will test your program.
EECS 4415M
Submit
Use the “submit” command on a PRISM machine to turn in your program.
% submit 4415 topten topten.py
For the call to the “submit” utility above, “4415” is the code name for the class, “topten” is the nickname of the assignment, and “topten.py” is your program file that you are turning in.
(We should be using “git” for turning in, instead! Perhaps next time.)
My program is just 69 lines. So this isn’t too involved. (Yours may not necessarily be as compact.) However, do not put things off, of course. You will be needing to learn bits of python along the way. Doing things incrementally is good advice.
If you do not finish the plot component, print the top ten words (along with their counts). This would be worth partial credit.
Due: Friday 22 January before midnight.

